Living Annuity app
Living Annuities, Retirement Income Draw-Down etc are all basically the same product given different names in different countries. You invest a lump sum and draw a monthly “pension” income. To protect the life of your capital, most countries have a limit on the percentage of capital you may draw as income. This limit is the reason why this type of investment continues to provide income – virtually for life. Obviously the lump sum you invest will be placed into an investment growing at a certain growth rate. Depending on the amount of income you draw and, if the income is inflation linked, then there may come a time when your income may begin to decrease alarmingly and this app will explain exactly why this can happen and when it can happen.
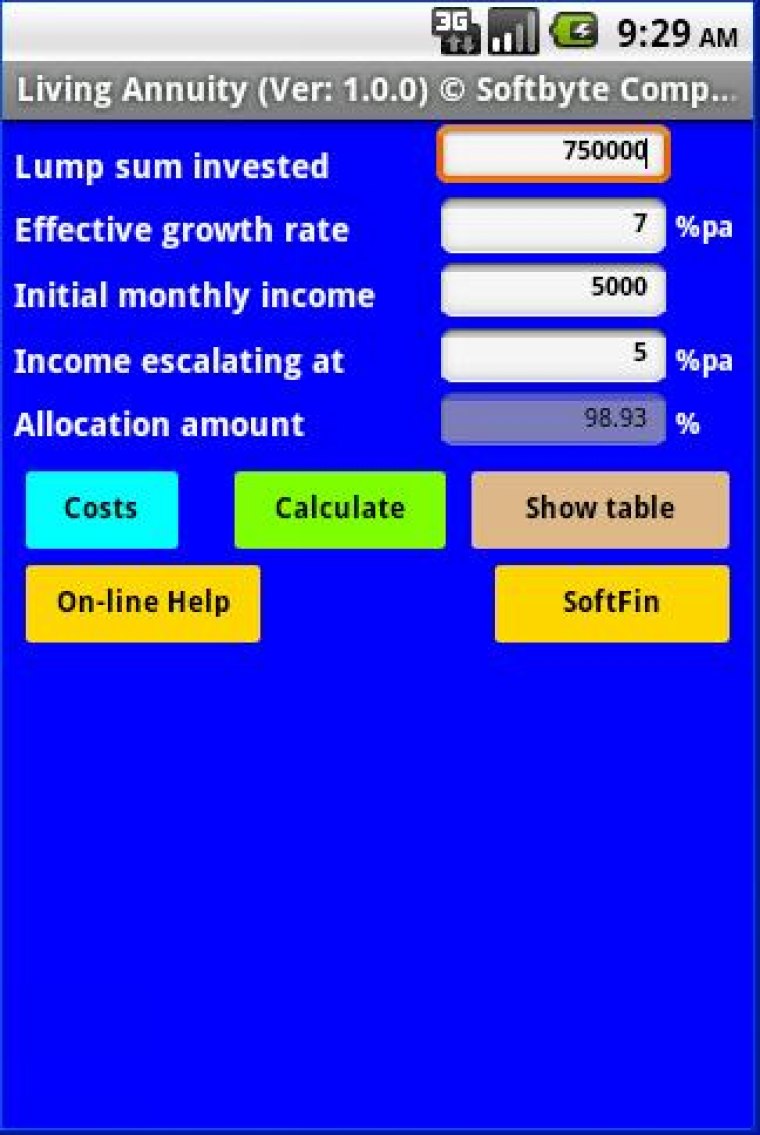
The 750,000 bucks has been invested in a Living Annuity investment with a growth rate of 7% pa. Income of 5,000 pm has been requested and escalating at 5%pa. The app shows that, after initial costs and commissions, 99% of the 750,000 is actually allocated to the investment.
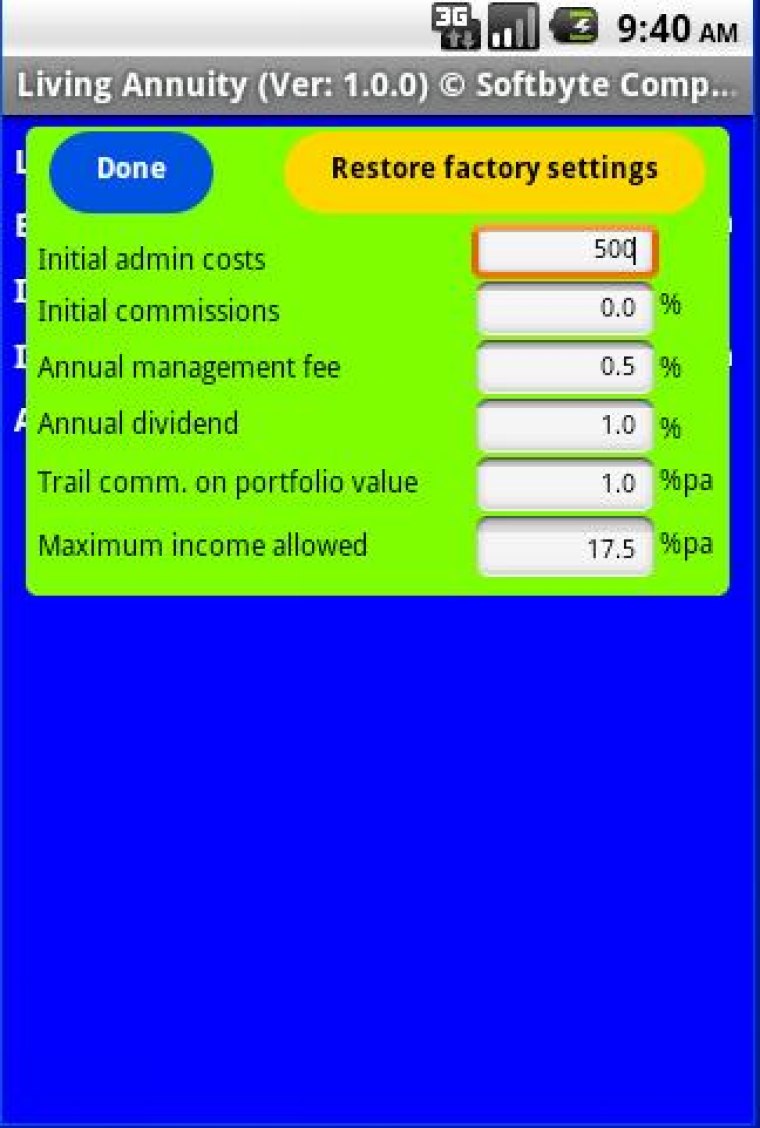
The “Costs” button allows you to setup initial commissions and costs, admin fees, regular trail commissions on portfolio value etc. You may also set the maximum percentage of income drawn. Any of these factors will affect the performance of the investment.
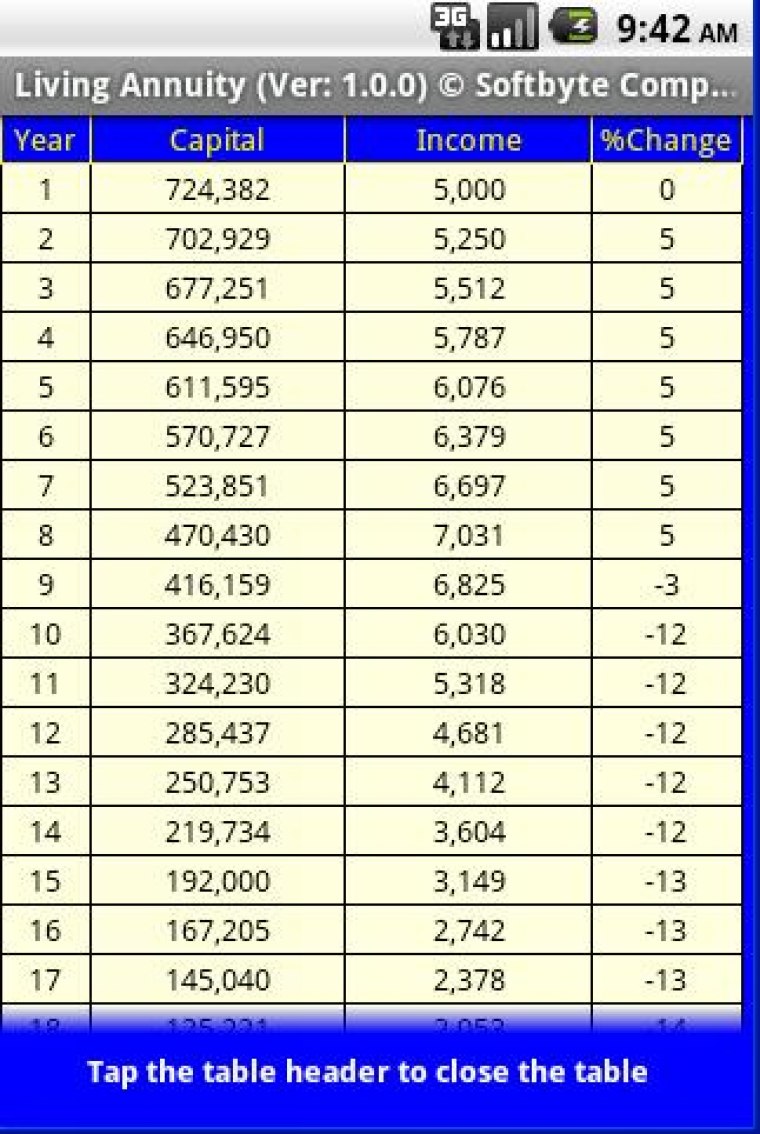
When we click on the “Show table” button we see the progress of our investment, year by year, for the life of the investment (while any capital still remains to provide income). Simply wiping a finger up or down the screen scrolls the table up or down to reveal more of the table. Tap the table column header to close the table. We can immediately see how long our invested capital will continue to provide the income we require. The table runs up to a maximum of 50 years or until the capital runs out. The table shows that, for the first 8 years, we receive our requested income increasing at 5% per year while our capital has been slowly decreasing as we have steadily been drawing more income. However, because of increasing income drawn each year, sometime in year 8 our capital has decreased to a level where the limit on the percentage of income allowed means that we can no longer support an annual increase in income. In fact, the figures in the example show that while the capital is only growing at 7% we are now drawing 17.5% of capital as income – and 17.5% is the limit we have set on the “costs” screen. As the capital drops, so will our income. Obviously closing this table screen and going back to change income amounts or income escalation rates (or anything we like) could then provide a whole new set of figures in the table. The app is so flexible that it even allows you to enter a negative income escalation rate to show the effect of taking an income which decreases each year. For the first time on your Android smart-phone, you are now able to show the investor exactly how his investment will progress, including being able to show them the real danger of taking too much income.
Note that the app may change any unreasonable figures entered to reasonable figures in order to produce an answer. For example, if you ask for a monthly income escalating at 99% pa then the app may change the escalation rate to a more reasonable figure. If you say you want to place 500 bucks into a Living Annuity and draw 1,000 bucks a month income then the app may reduce the 1,000 monthly income amount you requested to a more reasonable amount.
Note that you may be required to change the Security setting on your phone/tablet to allow you to temporarily install “non-market apps”. After installing the LivAnn app from our web site we recommend that you change this setting on your phone/tablet back to not allow the installing of “non-market” apps.